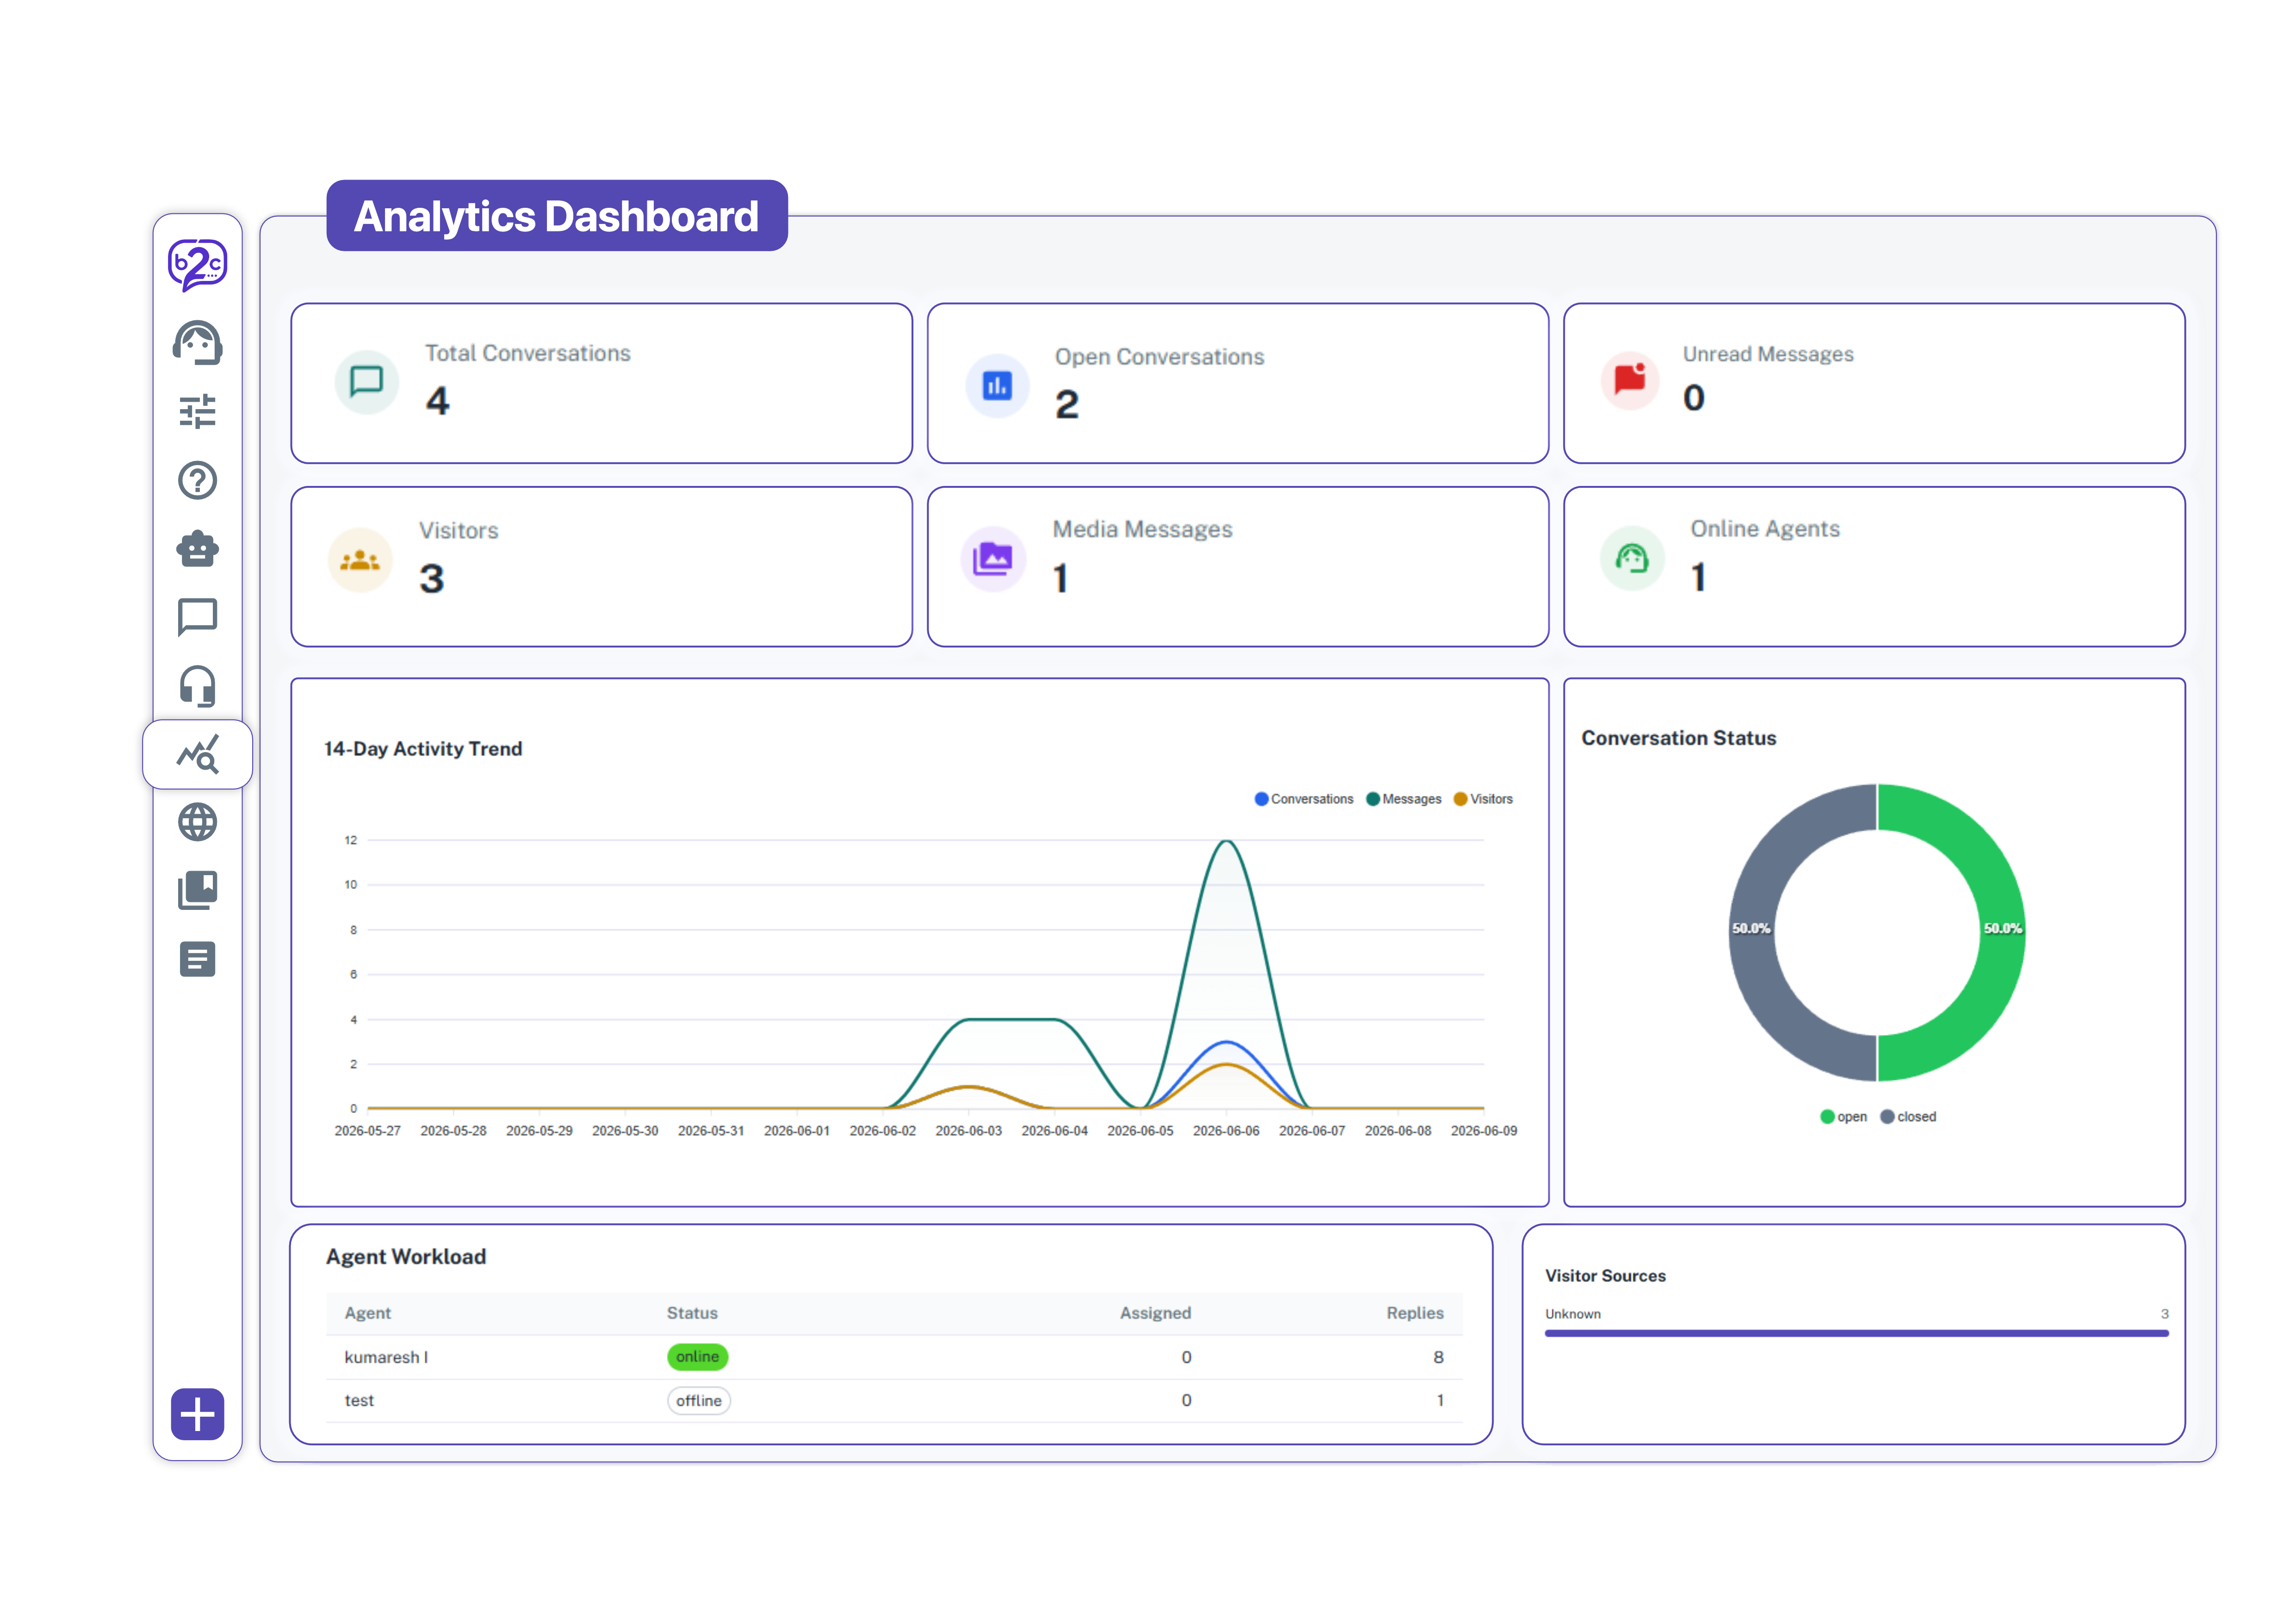
The Brand2Chat Analytics Dashboard gives you a real-time view of your entire support operation. Track how many conversations are happening, how quickly your agents are responding, how many visitors are on your site, and the overall health of your support queue all from one screen. Use these insights to make better decisions about staffing, response quality, and customer experience.
How to Access the Analytics Dashboard
1. Log in to your Brand2Chat account.
2. Click on Dashboard in the left-side navigation menu.
3. Select Analytics Dashboard from the expanded menu.
4. The Analytics Dashboard will load with your current support metrics and activity charts.
What You Can See on the Analytics Dashboard
Key Metrics Cards
At the top of the dashboard, six metric cards give you an instant snapshot of your support activity:
- Total Conversations - the total number of conversations started by visitors in your workspace.
- Open Conversations - the number of conversations that are currently active and have not been closed yet.
- Unread Messages - the number of messages from visitors that have not yet been read by an agent.
- Visitors - the total number of unique visitors who have interacted with your chat widget.
- Media Messages - the total number of file or image attachments exchanged in conversations.
- Online Agents - the number of agents currently active and available to handle conversations.
Average First Response Time
Displayed at the top right of the dashboard, the Avg first response metric shows your team’s average time to send the first reply to a visitor. This is a key indicator of your support team’s responsiveness (for example, “Avg first response: 1.8 min”).
14-Day Activity Trend Chart
A line chart showing your support activity over the last 14 days, with three tracked data points:
- Conversations - total conversations started each day.
- Messages - total messages exchanged each day.
- Visitors - total unique visitors each day.
Use this chart to spot patterns such as your busiest support days, seasonal peaks, or the impact of a new product launch on incoming queries.
Conversation Status Chart
A donut chart showing the proportion of your conversations by status:
- Open - active conversations still in progress.
- Closed - conversations that have been resolved.
This gives you a quick read on how well your team is keeping up with and resolving incoming chats.
How to Read Your Dashboard
1. Go to Dashboard → Analytics Dashboard from the left sidebar.
2. Review the metric cards at the top for a real-time count of conversations, visitors, and agent availability.
3. Check the Avg first response time at the top right to assess your team’s response speed.
4. Scroll down to the 14-Day Activity Trend chart to understand your conversation patterns over time.
5. Review the Conversation Status donut chart to see the ratio of open to closed conversations.
Using the Dashboard to Improve Support Performance
- High Unread Messages count - if this number is consistently high, it may indicate your team needs more agents or faster response processes.
- High Open Conversations - a large number of open conversations relative to online agents suggests conversations are not being resolved fast enough. Review agent workload and consider adding capacity.
- Slow Average First Response - if response times are longer than your target, look at staffing during peak hours or enable AI Chat to handle initial queries automatically.
- 14-Day Trend spikes - sudden spikes in conversations or visitors can indicate a product issue, a marketing campaign going live, or a surge in demand. Use this to plan ahead.
Troubleshooting
Metrics on the dashboard appear as zero
- Check that your chat widget is active and that conversations have taken place. If your Brand2Chat account is new, metrics will be zero until visitors start chatting.
- Refresh the page to pull the latest data. Dashboard metrics update in real time but may occasionally require a page refresh to display the most current figures.
The 14-Day Activity Trend chart is not showing data
- Confirm that live chat has been enabled and that at least some visitor conversations have occurred within the last 14 days.
- Check that the Enable Live Chat toggle is turned ON in Live Chat → Live Chat Setup so that conversations are being recorded.
Online Agents shows zero even though agents are logged in
- Agents must have the Agent Inbox open and be actively logged in to Brand2Chat to be counted as online.
- Ask your agents to refresh their session or log out and back in if they appear offline despite being active.